I am now at a stopping point for the views that I have been working on. I need to go back and finish up the data part. Can I just say I’m not a big fan of the data stuff.
Building my views
Weez told me I should get the views working so that is what I have been currently working on. I am therefore taking a small break from the data aspect.
I managed to dynamically build the year, month, and week view. However, I totally forgot about the triangles! Luckily, Matt informed of a way to do it so at least I won’t have to redo everything.
I spent 4 hours yesterday trying to figure out if it was possible to change the thickness of a stroke(the color segment) at runtime. Unfortunately, the only way that can be accomplished is if I drew the segment via code. So after moments of pondering in my head and recalling my first flash class, I realized that the most easiest way for me to change the thickness is to have different frames with different strokes. Therefore, I would just change the stroke via frame.
Things I have accomplished so far:
- Dynamically built the year, month, and week view.
- Managed to figure out a way to change thickness.
Things to get done within the next few days:
- Figure out how to attach the triangle and make that segment bigger. (Will be done by today 4/14)
- How to access the instances on the timeline via code. (Will be done by today 4/14)
- Figure out how to build the day view. This is different from the rest of the views due to overlapping and the spanning of time and it cannot be in an individual segment. This will take a couple of days for met to figure out and build it.
I am quite happy with myself so far. I just have to keep on plugging away. Once the views have been built, I will work on the interaction.
Overwhelmed, Scared, and Nervous
I am a slow coder. Looking back at my proposal, I realize I should have taken some things off. What was I thinking!?!? But everything is going okay. Matt helped me with my xml structure and Weez helped me refocus. Take baby steps….I can do this.
Begin Implementation Phase
Yesterday, I was over at Weez’s house for our bi-weekly Capstone dinner. This is where a bunch of capstone students gives her an update and receive feedback and eat! I showed her my latest design and asked for her opinions in regards to the Day view in the all day section cause I seriously did not know what to do. After some discussion, we came up with a plan. It would have bands and a picture will be in each band. Once the user selects that band, it comes to the foreground. So now begins the implementation phase! I am mighty scared!
Troubles and Evolution
The past couple of weeks have been hectic with prepping my portfolio and resume for the career fair this week. I did continue to work on my design but not as much as I had wanted to do. During past couple of weeks, I kept running into problems. I am in between the design and implementation phase at this point. I’m drawing the final design which will show how everything will look. However, I am also keeping in mind that I will be using the design will need to be easy to implement. I did not realize how difficult it is to draw a curved grid with perspective. I spent a lot of time trying to figure out the best approach. I then realized that the initial design might be difficult to implement and it did not look right as well. (See initial design at the bottom of the post).
So I revamped and came up with another design (See Version 2). However, I was worried about implementing it and I was worried about the information that would be displayed in the year and month view.
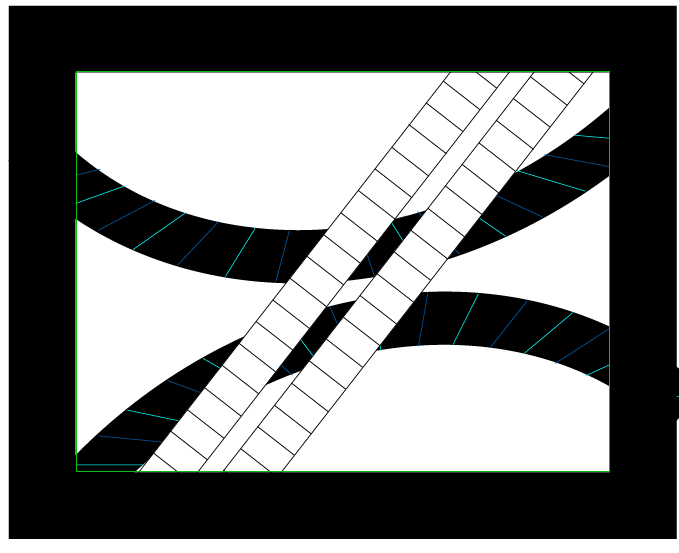
On Easter, I came across a tool in Illustrator that made drawing grids and curved grids a snap. How did I not realize this?!? Needless to say, I was…peeved and frustrated. So I went back and started to draw. I then came up with this design (see Version 3). This design is not literal and is more abstract. However, upon after discussing this design with my capstone committee, this design would act more like a sundial. This is due to not only the look but the interaction as well. However, it was not a complete sundial due to the linear line of the Day view.
I then went back and turned it into a curve. My metaphor has now evolved from “Life is a Highway” to the sundial. I still had concerns with the information for the year view and month view. After discussing an idea with Elouise, I’ve decided to use segments where each segment would represent a category. Once the user clicks it, a pop up of the events that fit into the category will display. Priority of the events will be displayed by size. For example, a bigger picture is more important the the little picture. The only time the user will see the actual picture in the curve will be in the day view. (See latest version and day close up). In regards, to how the user will see each view; when the user selects the view, the screen will zoom in on that view and fade the other views out. I shall post some pictures tomorrow with the fade and zoom.